

Stay informed
Explore our press releases and curated features and stories to stay up-to-date on our most recent announcements, breakthroughs, and achievements.
If you’re interested in covering our work, don’t hesitate to get in touch with Kito Cetrulo, Vice President of Communications and Engagement. Email: kcetrulo@carnegiefoundation.org
Featured
News
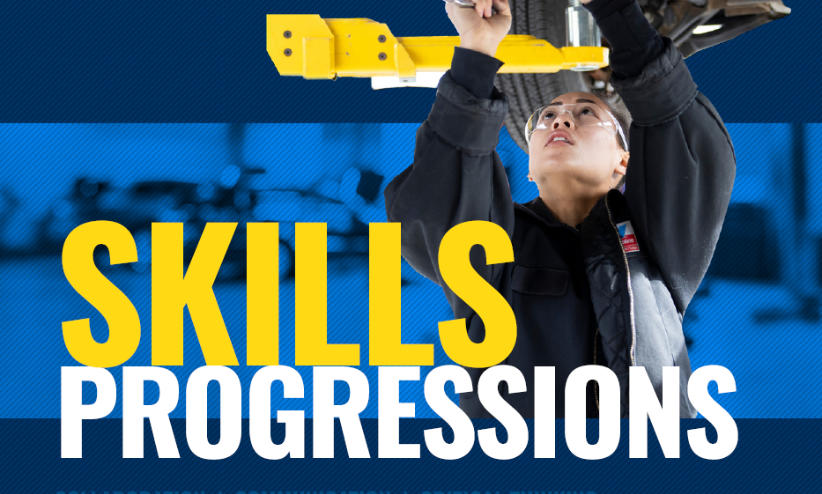
Carnegie Foundation and ETS Release Skills Progressions for Collaboration, Communication and Critical Thinking
The Carnegie Foundation and ETS have jointly released three Skills Progressions focused on Collaboration, Communication, and Critical Thinking. This work is part of Carnegie Foundation’s multiyear effort to transform the American high school and define a coherent set of science-based skills standards to complement and improve academic standards, ensuring learning is increasingly rigorous, engaging and career-aligned.
News
Carnegie Foundation Selects Colleges and Universities for 2026 Community Engagement Classification, Hosting of CE Moves from ACE to University of San Diego
Washington (Jan. 12, 2026)—More than 230 U.S. colleges and universities received the 2026 Carnegie Community Engagement (CE) Classification, an elective designation …
News
College Board and Carnegie Foundation Launch National Effort to Expand Teacher Pipeline for Career-Connected Coursework
Multi-state initiative will modernize certification pathways and pilot new professional learning model for high-demand fields New York, NY — College Board …

News
New National Effort Aims to Build the Future of High School
Carnegie Foundation launches “Future of High School Network” with 24 innovative school systems across the country. STANFORD, CA — June 18, …
Latest
News
Carnegie Award for Impact
The Carnegie Foundation for the Advancement of Teaching Is Proud to Announce the First Recipients of the Carnegie Award for Impact
The three 2026 Carnegie Award for Impact recipients are each having a significant impact on student success in high school …
News
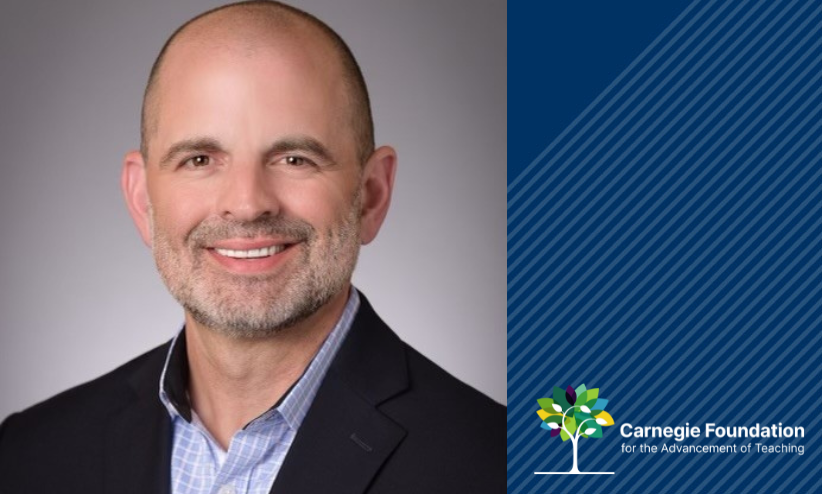
Carnegie Foundation Welcomes Brad Jewell as Chief Financial Officer
STANFORD, Calif. – January 27, 2026— The Carnegie Foundation for the Advancement of Teaching (Carnegie) today announced that Brad Jewell …
News
Featured
Carnegie Foundation and ETS Release Skills Progressions for Collaboration, Communication and Critical Thinking
The Carnegie Foundation and ETS have jointly released three Skills Progressions focused on Collaboration, Communication, and Critical Thinking. This work is part of Carnegie Foundation’s multiyear effort to transform the American high school and define a coherent set of science-based skills standards to complement and improve academic standards, ensuring learning is increasingly rigorous, engaging and career-aligned.
News
Featured
Carnegie Foundation Selects Colleges and Universities for 2026 Community Engagement Classification, Hosting of CE Moves from ACE to University of San Diego
Washington (Jan. 12, 2026)—More than 230 U.S. colleges and universities received the 2026 Carnegie Community Engagement (CE) Classification, an elective designation …
News
Featured
College Board and Carnegie Foundation Launch National Effort to Expand Teacher Pipeline for Career-Connected Coursework
Multi-state initiative will modernize certification pathways and pilot new professional learning model for high-demand fields New York, NY — College Board …

News
Board of Trustees, Champlain College
Carnegie Foundation Appoints President of Champlain College to Board of Trustees
Alex Hernandez to help shape national efforts to strengthen higher education and advance high school transformation. STANFORD, Calif. — The …

News
High School, R&D Agenda
Carnegie Foundation Launches Research and Development Agenda to Transform the American High School
The R&D Agenda outlines knowledge-building and tool-making priorities to drive a national shift from seat time to real-world, competency-based high …
News
Featured, Future, High School
New National Effort Aims to Build the Future of High School
Carnegie Foundation launches “Future of High School Network” with 24 innovative school systems across the country. STANFORD, CA — June 18, …
News
Higher Education, Student Success
Carnegie Classifications Redesign Better Reflects the Higher Education Landscape and Recognizes Student Success
A new Student Access and Earnings Classification recognizes the wide variety of institutions fostering opportunities for students nationwide Washington, D.C. — …
News
Featured, Methodology, Research
Carnegie Classifications Release 2025 Research Activity Designations, Debut Updated Methodology
Washington, D.C. — The American Council on Education (ACE) and the Carnegie Foundation for the Advancement of Teaching (Carnegie Foundation) …

")

")
")